By Laurie Weston
BIG Media
The eruption of SARS-CoV-2, or COVID-19, in 2020 changed the world in many ways. There was an understandable amount of fear in those early days. One of the concerns was the alarming number of people dying of the disease, resulting in the hasty implementation of well-intentioned measures to prevent as many of those deaths as possible.
Alberta, Canada, was no different, mandating masks, lockdowns, and restrictions of all kinds. Measures such as these probably saved some lives, but now that the data on deaths of all causes is available for that year, a stark accounting of the benefits and consequences of those decisions can be assessed.[1] Who died, from what, and were we as successful in preventing deaths as we intended?
Actual death rates (per 100,000) by age group and gender for 2003 to 2020 are shown in the charts in Figure 1 (reproduced from the recent BIG Media article A look back at causes of death in the first year of COVID-19). The contribution from COVID is shown separately as a red addition to the 2020 bars. It is quite clear, that even without COVID, in most age groups, the death rate increased in 2020. What death rate could we have expected in 2020, and what caused the increase?
Figure 1: All causes of death in Alberta (per 100,000 population) by year, gender and age group (tabs). Deaths attributed to COVID-19 are shown in red on the 2020 bars.
Looking at this information at a more granular level can provide insights about expected death rates and deviations from those expectations. “Excess deaths” is the term given to an estimate of the number of deaths over and above what might be expected in a given time period.
We will start by dividing the age groups into smaller, 5-year, categories that minimize averaging of age-related variations. The expected 2020 death rates in each of the categories can be calculated using a simple linear extrapolation of a multi-year trend through 2019. Figure 2 shows an example of this for the 30-34 age group. The multiple trend lines shown on this graph illustrate the uncertainty in estimating expected death rates.
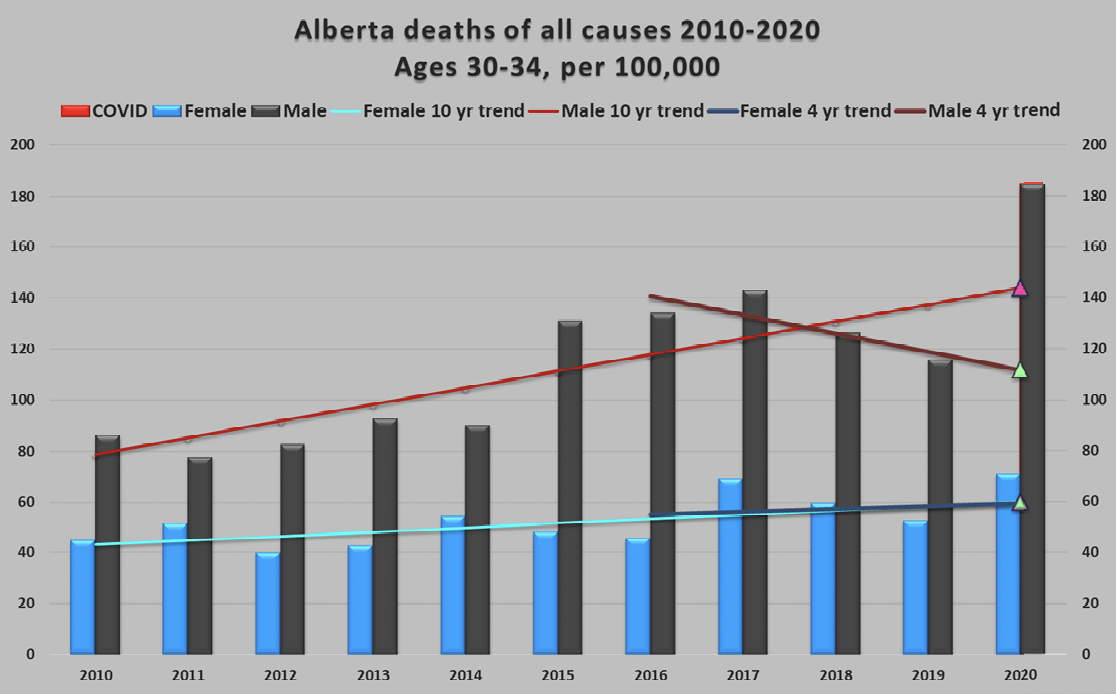
Depending on the reference period chosen, significantly different values for these expected death rates could result. In the example shown, the expected death rate for men aged 30-34 is 144 per 100,000 using a 10-year reference, or 112 per 100,000, using a 4-year reference (the female 10-year and 4-year results are almost identical). Statistics Canada notes this uncertainty in a blunt statement on its website: “There are a number of challenges associated with measures of excess deaths.”[2] They use a reference period of “approximately” four years (2016-2019) for estimates of weekly expected deaths in 2020. Because they are predicting weekly, they also use complex models to remove seasonal trends and, in addition, adjust for “collateral impacts of the pandemic, such as deaths occurring because of the overwhelming of the health care system, or deaths avoided due to decreased air pollution or traffic.” These adjustments increase the complexity of the modeling, compounding uncertainty in the process.
Trusting that Statistics Canada has considered the relevant factors and has sound reasoning for choosing a four-year reference period, I used the same. However, since I am looking at full-year comparisons, seasonal adjustments are not necessary, and there were insignificant differences in Alberta deaths due to decreased air pollution or traffic between 2020 and typical years.
Deaths due to an overwhelmed health system are not reported as such but would be reflected in increased deaths in particular categories, and therefore show up in the general estimate of excess deaths (the largest contributors of which are discussed later in the article).
The linear extrapolation of that 4-year trend gives us an expected death rate in 2020 for each age group and gender. We can then use that rate (deaths per 100,000) and the 2020 population of each group to determine the absolute number of deaths to expect. Figure 3 shows the difference between the actual number of deaths in 2020 and the expected number of deaths calculated by this method.
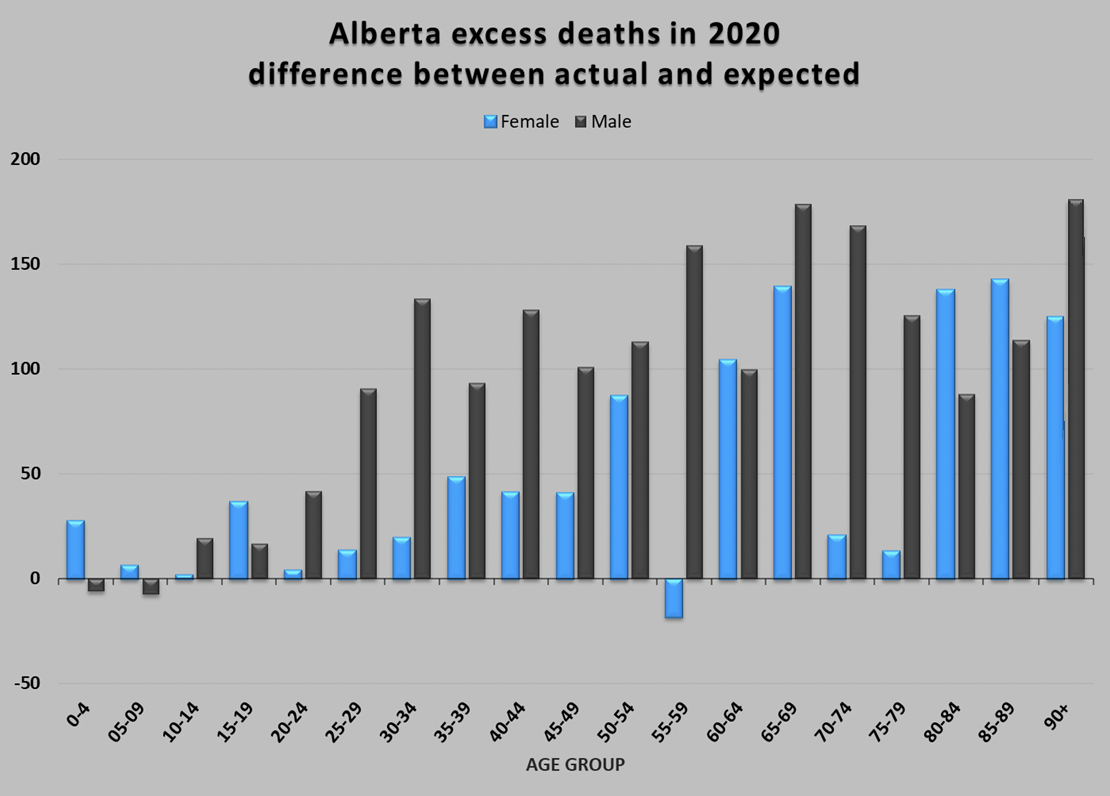
In every age and gender category with the exception of under-10-year-old males and 55-59-year-old females, there were more deaths in 2020 than expected. We know how many of these deaths were COVID, so we can separate them from the rest. Figure 4 shows the COVID deaths distinctly from all other excess deaths in separate male and female graphs. This is where the story gets particularly interesting, and the data starts to reveal insights.
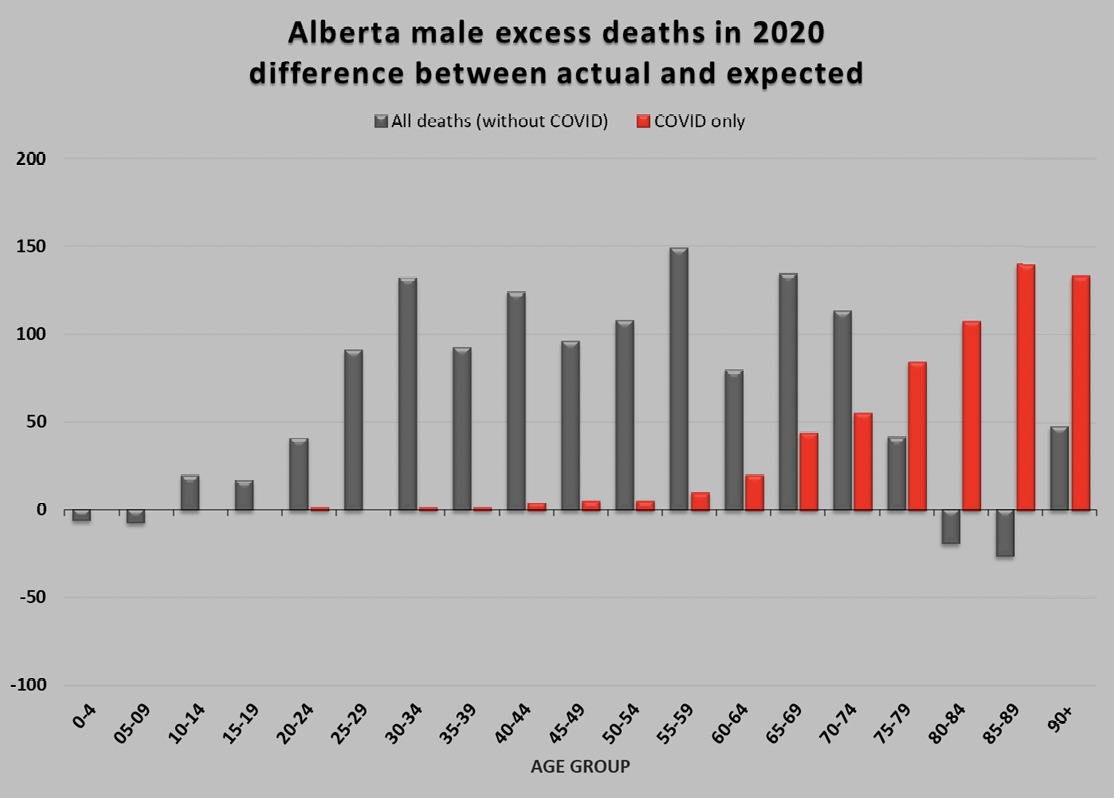
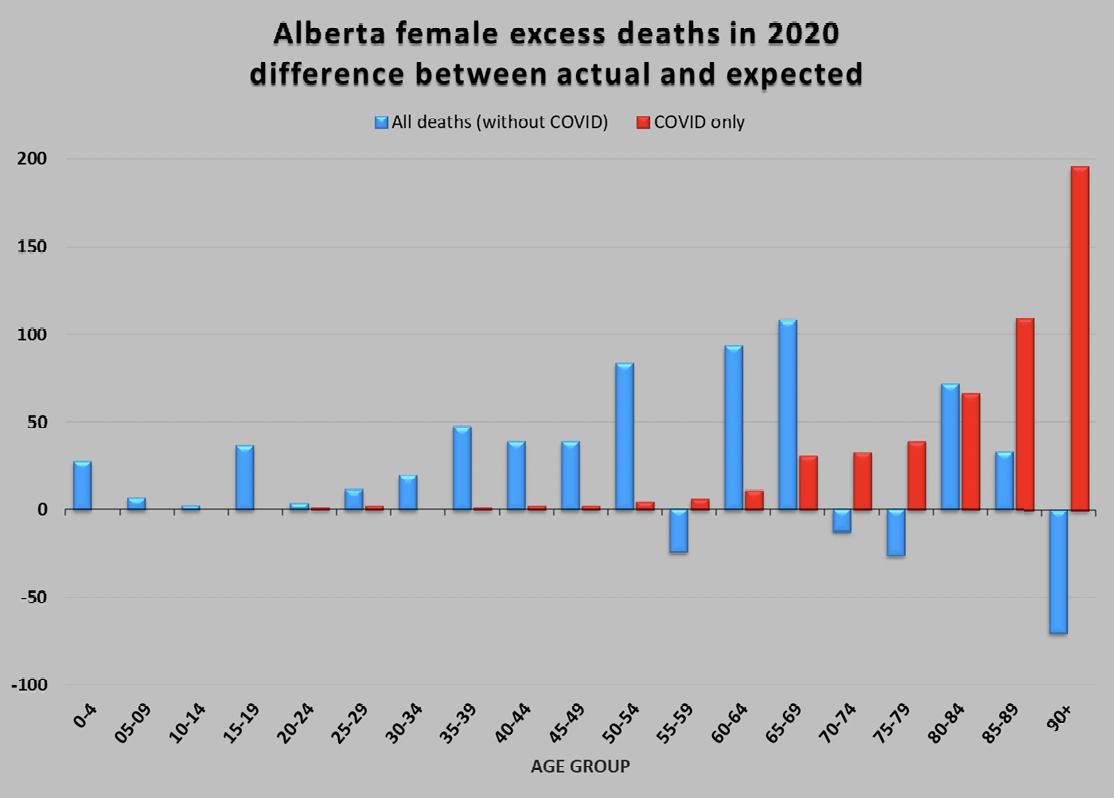
There are very different profiles of deaths due to COVID (which are, by definition, “excess” because there was none in previous years) compared to excess deaths due to everything else. As expected, the older demographics were hit hard by COVID. In age groups where the COVID deaths exceeded the total excess deaths, deaths of other causes must have decreased for the math to work out. This results in lower number of deaths of other causes than expected (for example in females over 90), implying that some of the people who died of COVID were likely to have died that year anyway of something else.
The excess deaths of causes other than COVID reveal a disturbing picture. For males, the total number of COVID deaths in Alberta was 610; 74% of those deaths occurred in men over the age of 80. In contrast, the total number of excess deaths in 2020 of all other causes was 1,223; 76% of those in men under the age of 64. When someone over 80 dies of anything, we grieve the loss, but there is relatively little injustice to this death. “She had a good, long life,” we say. On the other hand, the untimely death of a 40-year-old generally sends long-lasting shockwaves through their families, friends, co-workers, and community.
While every COVID-19 death was publicly tallied and mourned, many of these other ones probably happened privately, in quiet despair and desperation. What were the causes of these other deaths? It’s difficult to say for sure, but, in men age 20-64, the death categories that increased in 2020 over 2019 are shown in Figure 5, proportional to the estimated total number of excess deaths in that age group.
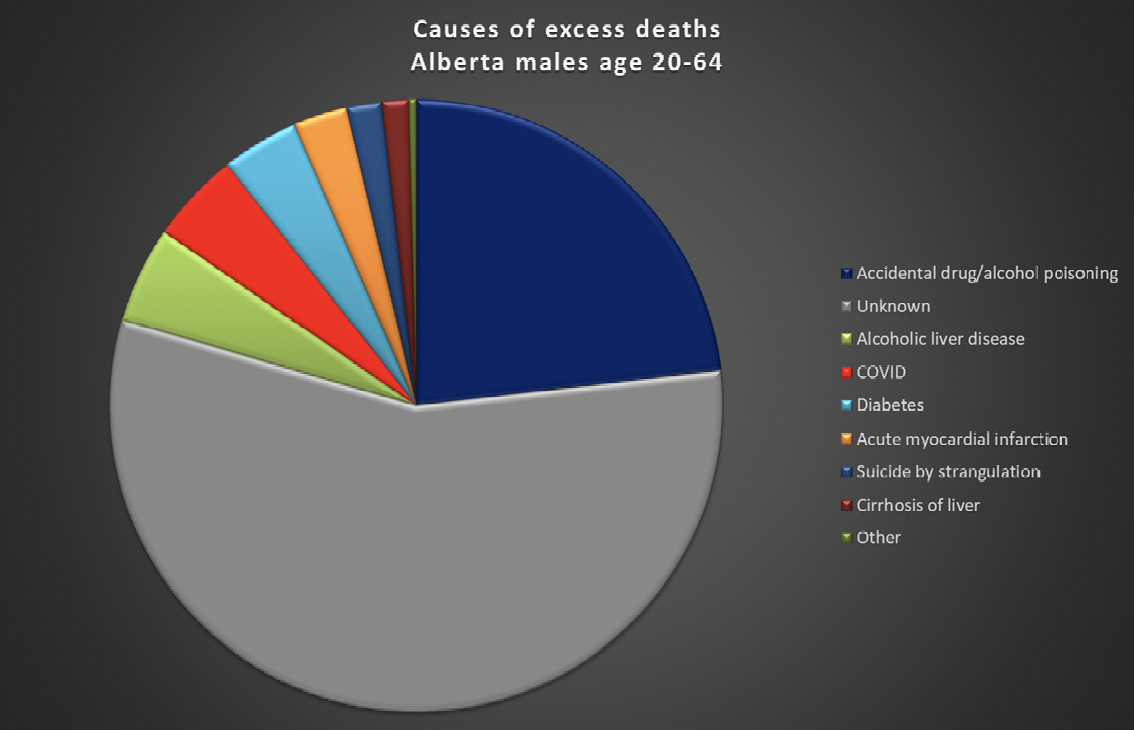
56% of male excess deaths in the 20-64 age group are due to unknown causes. Because they make up so much of the pie, these unknown causes were investigated further with an inquiry to the Alberta government. The explanation was that they represent unnatural deaths requiring additional review – namely suicides, accidents and homicides. They will be reclassified as these examinations are completed. Homicides, thankfully, do not represent a large proportion of deaths in Alberta, but suicides and accidents do, especially in this demographic. 23% of the known excess deaths are due to accidental poisonings related to drugs or alcohol; 4% are due to COVID. Why so many more deaths, especially in men age 20-64, and especially in categories such as drugs, alcohol, and suicide? This is the demographic most affected by the loss of jobs, businesses, and social and recreational activity due to COVID restrictions. Could these deviations from projected death totals be mere coincidence?
It is likely that there were significant unintended and lasting consequences of our society’s approach to the COVID-19 pandemic. There were never any easy answers, but these consequences would have been apparent to governments as the data was coming in. (They did not have to wait, as we did, for the data to be available publicly). As more is learned about these indirect, potentially unanticipated, effects of policies and decisions, adaptation and modification of those policies are vital.
[1] https://open.alberta.ca/opendata/deaths-cause-by-gender-and-age accessed January 2, 2022
[2] https://www.statcan.gc.ca/en/statistical-programs/document/3233_D5_V1 accessed March 7, 2022.