By Laurie Weston
November 1, 2022
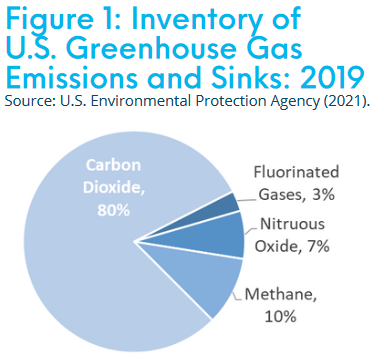
Every activity, natural or manmade, from breathing to driving, generates emissions of some kind. Certain emissions are worse than others, causing pollution or, in large quantities, affecting the composition of the atmosphere. Greenhouse gases (GHGs), in particular carbon dioxide (CO ) and methane (CH ), generated by modern industry, transportation, and agriculture, have been rising steadily since the industrial revolution. These emissions are implicated in manmade influence on climate. Figure 1 shows the relative proportion of GHG emissions in the US in 2019.[1]
Close to three-quarters of all manmade GHG emissions come from energy use in industry, transportation, and heating/cooling of buildings (Figure 2, visit BIG-media to view). The next largest source of emissions is the agriculture sector, accounting for a further 18%, with the remainder produced by waste, cement, and chemicals.[2]
The largest proportional component of greenhouse gases is CO , sometimes simply referred to as “carbon”. Although carbon and carbon dioxide are not the same, they have become synonymous in political and media discussion of climate change. Carbon dioxide gas (CO ) is one of the places carbon resides, but carbon is a ubiquitous chemical in everything on earth, including living organisms. Carbon comprises 18% of our body weight and is literally part of our DNA.[3]
Just like other elements in the earth, carbon naturally cycles through the atmosphere, oceans, plants, animals, and soil in a complex interaction of chemical and physical processes. In part of that cycle, it can get sequestered for millions of years, as sediments and dead organisms sink to the bottom of oceans or lakes and are transformed by increasing pressures and temperatures into solid rock and fossil fuels. Carbon captured this way is normally gradually released back into the system through erosion and fluid maturation and migration, but humanity’s direct extraction of fossil fuels has accelerated part of this process, shortcutting the natural carbon cycle.
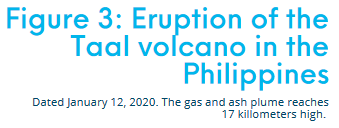
There is no doubt that the burning of fossil fuels is a significant source of GHGs, particularly CO . But in addition to the gradual natural processes just mentioned, there are catastrophic (in the geological sense) natural events that release massive amounts of gases and particulate matter into the atmosphere. Look at this spectacular picture of the Taal volcano in the Philippines erupting in 2020 (Figure 3).
One large volcanic eruption such as Taal can release millions of kilograms of GHGs into the atmosphere. Between May 3 and Aug. 5, 2018, the Kilauea volcano in Hawaii erupted. On one of those days, July 11, an estimated 77.1 kilotons (70,000 metric tonnes) of CO were emitted.[5]
If that amount is assumed on every day of the eruption, this volcano was responsible for adding 6.57 million metric tonnes of CO to the atmosphere. Remember this number when we get to the calculations of human contributions.
A recent BIG Media article, Climate change and energy: context for the great debate, reported global energy use by source from 1965 to 2020 (Figure 5, visit BIG-media.ca to view).[6] Each of these sources have associated GHG emissions according to the life-cycle estimates shown in Figure 4.[7][8][9] Substituting the appropriate mean emissions intensity for each of the energy sources shows us the contribution of each of those energy sources to global emissions (Figure 5, visit BIG-media.ca to view).
Total emissions worldwide in 2019 were 37.5 billion tonnes. This is more than 4 million tonnes per hour. Recalling the number from the Kilauea volcanic eruption of 6.57 million tonnes, to put this in perspective, 94 days of eruption of a large volcano emits as much CO as about 1.5 hours of human activity.
Figure 5 (visit BIG-media.ca to view) shows that fossil fuels are the largest emitters among the energy sources. But not all fossil fuels are created equal. Coal, for example, contributed 27% of the global energy mix in 2019, but its use was responsible for nearly 40% of emissions. Natural gas is the cleanest-burning fuel with emissions intensity approximately half that of coal for the same energy output. Replacing coal with natural gas reduces emissions.
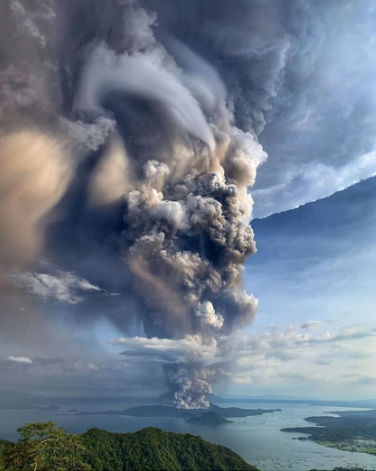
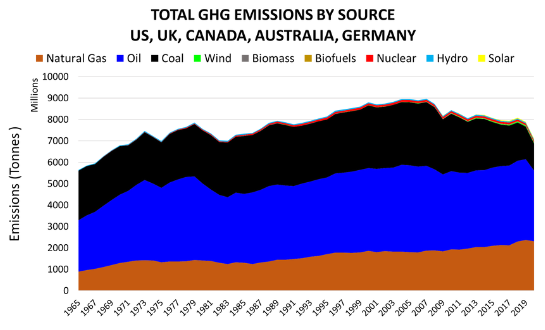
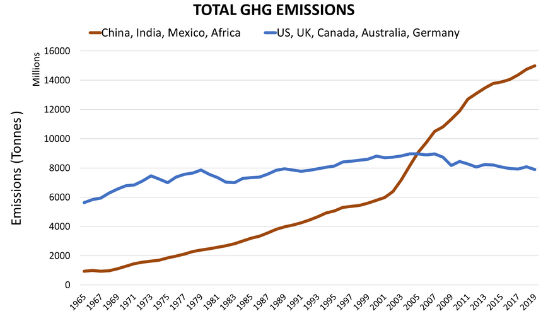
Why is that relevant? The answer can be seen in the emissions charts (Figure 6, next page) divided between a selection of “first world” countries (U.S., U.K., Canada, Australia, Germany) and a selection of developing countries (China, India, Mexico, Africa).
It is apparent from these charts that emissions in the developing world are growing at an alarming rate, compared to recent decreases in the developed countries.
Coal use in particular has diminished in developed regions, replaced in large part by natural gas, but has been growing significantly in the developing world. This is illustrated in Figure 7 (visit BIG-media.ca to view), comparing CO emissions by fuel type for the U.S. and China. In the year 2000, the U.S. and China were approximately equal in emissions from coal. Since then, the U.S. has decreased its emissions from coal by 50%, and China has increased by 300%.[10]
Modern society has been driven by fossil fuels, the availability of which directly powers standard of living. In recent years, gross domestic product (GDP), has become decoupled from energy use in the developed world.
This is not yet the case in developing countries. As they strive for the same standard of living as the first world, energy use follows (or leads). In general terms, the absence of accessible energy equates to poverty.
Efficient new technology takes decades to develop and scale up. Modern renewable technologies (solar and wind) have grown with concerted efforts over the last two decades.

Sources:
BP statistical review of world energy
Comparison of Lifecycle Greenhouse Gas Emissions
of Various Electricity Generation Sources,
2006 IPCC guidelines for national
greenhouse gas inventories
Despite this focus, its share is barely keeping pace with growth in energy demand. In 2019, solar and wind energy generation accounted for only 3.3% of global energy supply (Figure 5, visit BIG-media.ca to view).
In practical terms, no energy source is intrinsically bad – it is the emissions that cause problems. If our objective is to reduce emissions, renewables are not the only way. Rapidly improving technologies are helping reduce GHGs from fossil fuels, and capturing carbon at the source and from the atmosphere (Figure 8, visit BIG-media.ca to view).[11] Such technological advances are a critical factor in pursuing global emission reduction targets.
Since we cannot expect renewables to meet global energy demand for decades to come, fossil fuels will continue to provide the affordable energy the growing world population demands. Solutions to the “emissions crisis” will require co-operation between industry, academia, governments – and, perhaps most importantly, individual citizens – to consciously improve efficiency and establish an optimal, sustainable energy mix.